My research and primary work focuses on accessibility/disability studies, conservation/environmental writing, transpacific media, and where they intersect.
Research Interests
My research and primary work focuses on accessibility/disability studies, conservation/environmental writing, transpacific media, and where they intersect.
My thesis, “Connecting Bridges: A Critical Disability Reading of a A Silent Voice”, focuses on how we define disabilities and how we create environments that are often not accessible to everyone due to a combination of hostile architecture, structures, and systems that we continue to allow to exist without much critical thought. This isn’t what the whole thesis is about, but the undercurrent of accessibility issues are present throughout it and it is a problem that I have been researching, writing, and working on leading up to the completion of my thesis and afterword. From making a classroom universally accessible, to working on a non-profit’s website, accessibility and understanding what it means to be disabled in different contexts in both the imaginary worlds and our own are ideas I play around with on nearly a daily basis. Anyone can take simple steps to begin addressing accessibility concerns, like conducting color blind testing, organizing content through card sorting, and incorporating iconography and/or symbols. These efforts can be applied to various items such as websites, maps, governmental documents—essentially, anything can benefit from accessibility improvements. Let’s look at the two graphics below as an example as to how to improve accessibility in an easy manner that is often overlooked.
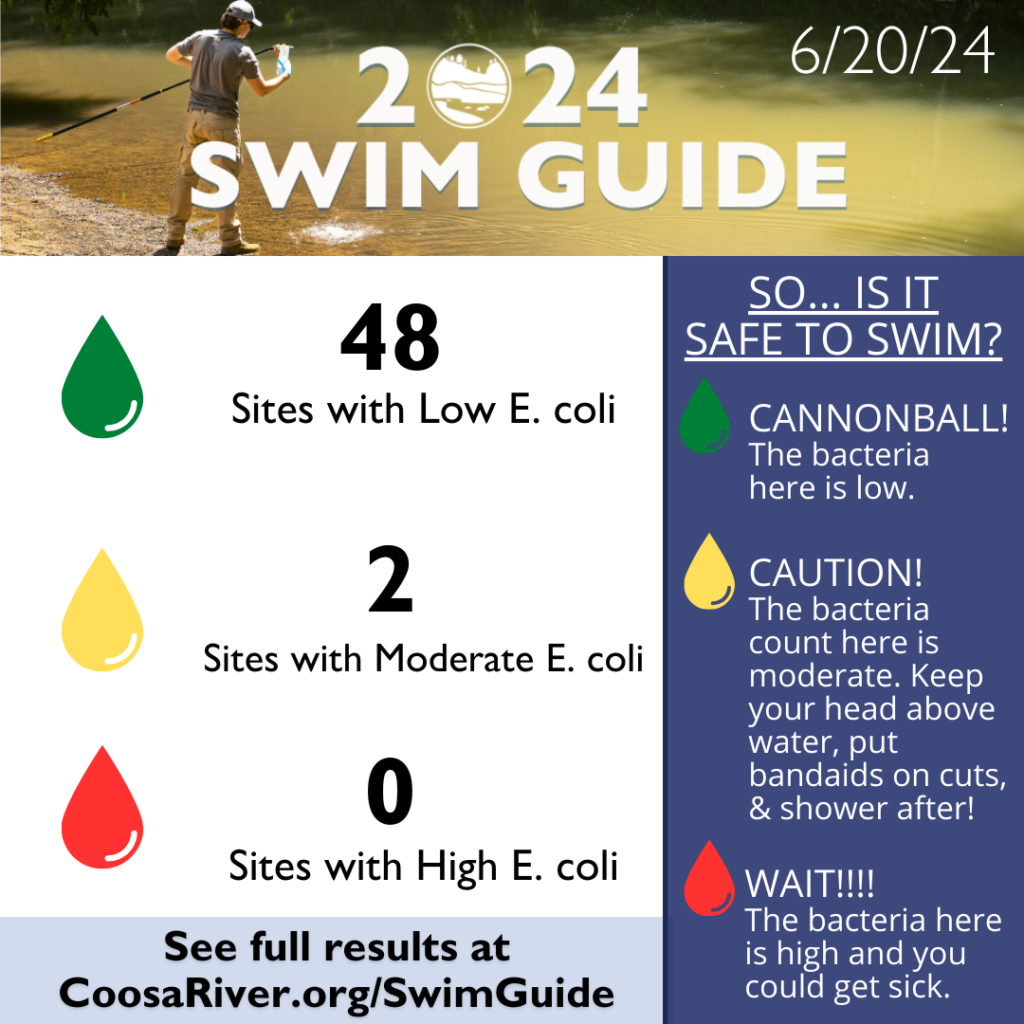
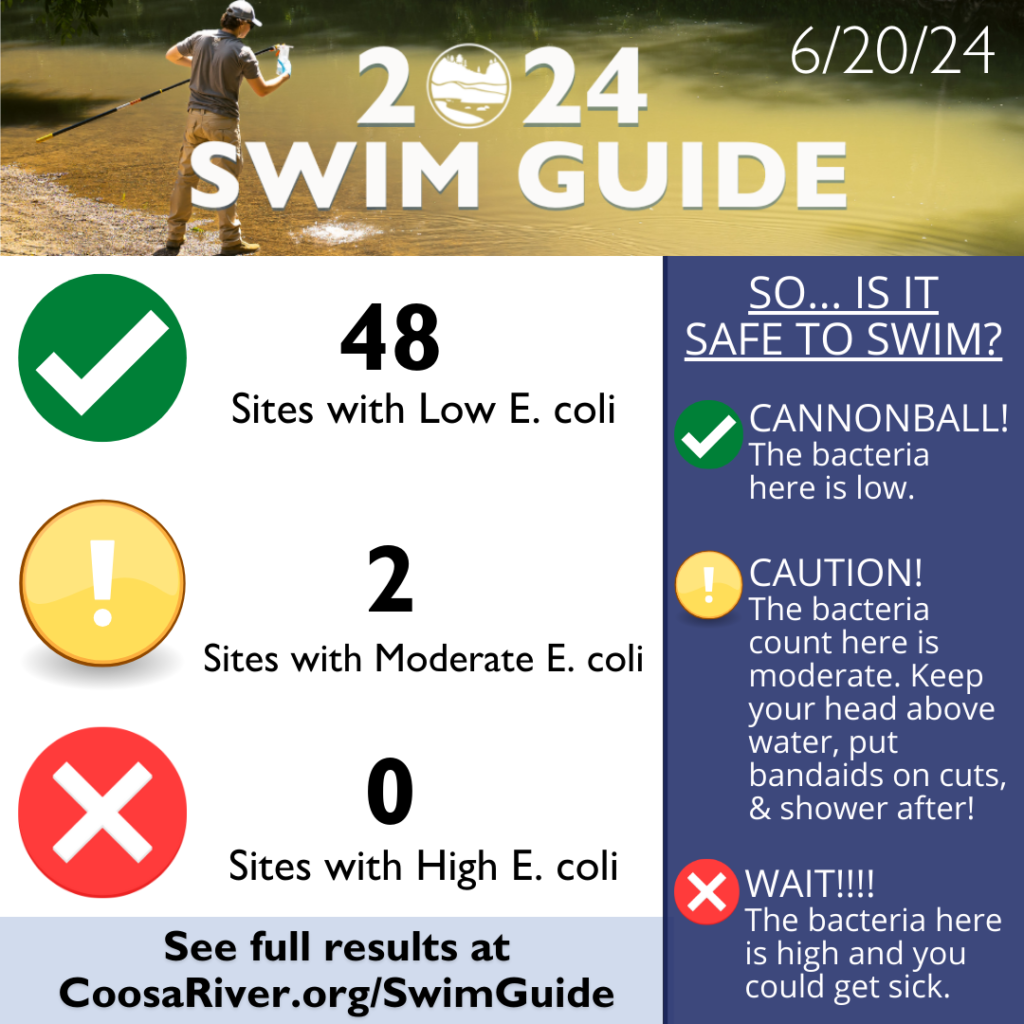
Graphic A and Graphic B both present data on water quality from the 2024 Coosa Riverkeeper Swim Guide season, but each uses different methods. Both provide links to full results, use proper labeling, and include a key to interpret their chosen images. So, why is Graphic B superior to Graphic A?
In Graphic A, an icon of water is used, which intuitively relates to Swim Guide’s water quality data. However, Graphic A assumes that viewers will distinguish between colors (which represent different water quality levels) and understand the order akin to a traffic light (green to red). This assumption overlooks that many people are colorblind, particularly red/green colorblindness affecting 1 in 12 men and 1 in 200 women. Additionally, not all traffic lights follow the same directional sequence.
Graphic B improves upon this by using symbols (instead of icons) more universally recognized for conveying information: a check mark for positive results, an exclamation mark for cautionary results, and an x for negative results. While this approach still involves some assumptions, it mitigates the issues of color recognition and interpretation encountered in Graphic A.
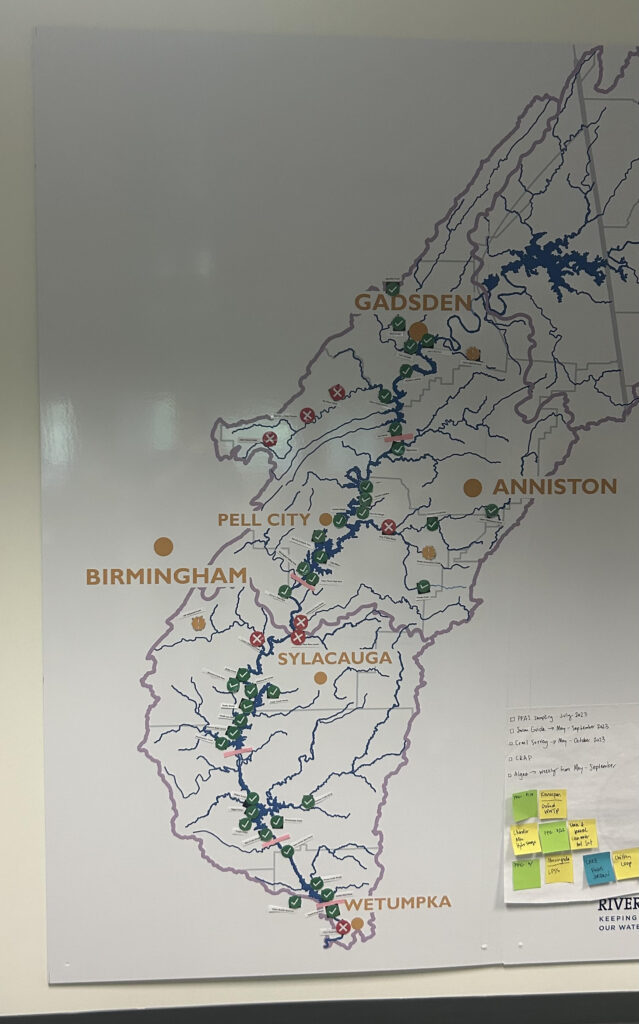
Therefore, Graphic B’s use of symbols enhances accessibility by ensuring that the information is comprehensible regardless of color perception or familiarity with specific color sequences. Graphic B is significantly more readable. Once the symbols are placed on a map, as shown in the image to the right, even individuals without color blindness can quickly identify the information being depicted. Just like a ramp placed in front of a building is intended for use by wheelchair users, others who do not use the accommodation may also benefit. Some individuals may even prefer walking on ramps due to personal preferences or hidden physical impairments and/or disabilities.
As provided by the graphic’s above, and hinted in the discussion of them, they are not perfect and truly universal. This is because to be universally accessible is a bit of an oxymoron. One can not truly be universal if there is always a new disability you never heard around the corner. Today’s disability is tomorrow’s ‘normal’ and vice versa. This is why it’s important to always be flexible and willing to change when new information is provided, as it is the designer who often makes individuals disabled due to our designs and decision making. The graphic discussion is just the tip of the iceberg when it comes to accessibility/disability studies, but it is a start nonetheless. Check out my portfolio for more information and examples regarding accessibility/disability as well as my other research interests that I did not really go into here.
Published Work
Dickey, T. (2023). “Connecting Bridges: A Critical Disability Reading of A Silent Voice. Thesis.
Dickey, T. (2023). “The Accommodation System is Hell: An Argument for UDL.”
Dickey, T. (2024). The Woman Behind the Sun.
Presentations
“Introducing The Anthropocene” w/ Dr. St. John, Sydney Lanier, James Galliher, James Rogers. March 2022. Huntsville Human Rights Film Festival. University of Alabama Huntsville. Huntsville, AL.
“The Accommodation System is Hell: An Argument for UDL.” February 2023. The Association of College English Teachers of Alabama. Clanton, AL.
Chair and Moderator. April 2023. UAH English Graduate Conference. Huntsville, AL.
“The Death of Magical Martyrs: An Exploration of Environmental Martyrdom in Karen Tei Yamashita’s Through the Arc of the Rain Forest.” February 2024. Michele Bowman Underwood Department of Languages and Literatures 2024 Graduate Student Conference. Miami, FL.
Grants
Below are a few select grants that I won during my time at Coosa Riverkeeper. We received many grants, but these are a few that I am proud of.
Mining Mini-Grant – Coosa River Graphite Mine – $4,000.00 (2023).
Coosa River RC&D Council – Swim Guide – $10,000.00 (2023).
Brabson Family Foundation – C.R.E.E.K. on Wheels – $5,000.00 (2024).
Contact Tyler
Email: tylerjaocbdickey@gmail.com